
| Version 3 (modified by , 15 years ago) (diff) |
|---|
Loading a .csv file as a graph using Open Office
Many files used by ANUGA are in the .csv format. With a little input from the user, these can be loaded as a spreadsheet in Open Office, or Excel, in Windows or Linux (Ubuntu in this example). The method is very similar for both applications and platforms, but the steps illustrated here use the freely-available Open Office spreadsheet application.
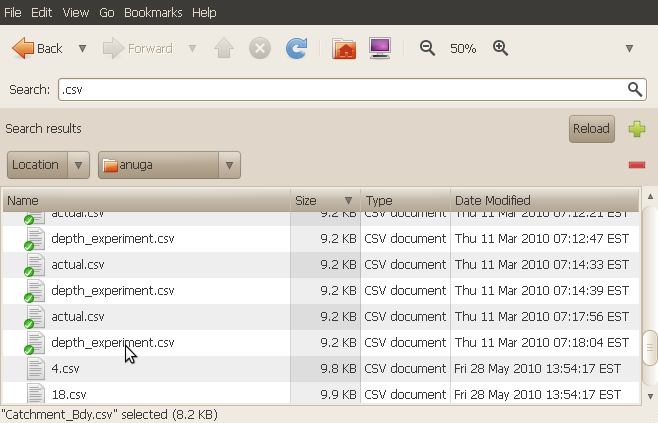
1. Open a CSV file
If you are using Ubuntu, it will automatically open .csv files using Open Office. If you are using windows, you may need to right-click on the .csv file, and then select the "Open With..." option, and choose Microsoft Excel.

|
2. Set formatting options
There is no common standard for .csv files, so you will need to tell the application a bit of information to help it open the file. Make sure the "comma" and "space" checkboxes in the "Separated by" box are both checked. Click OK to continue.

|
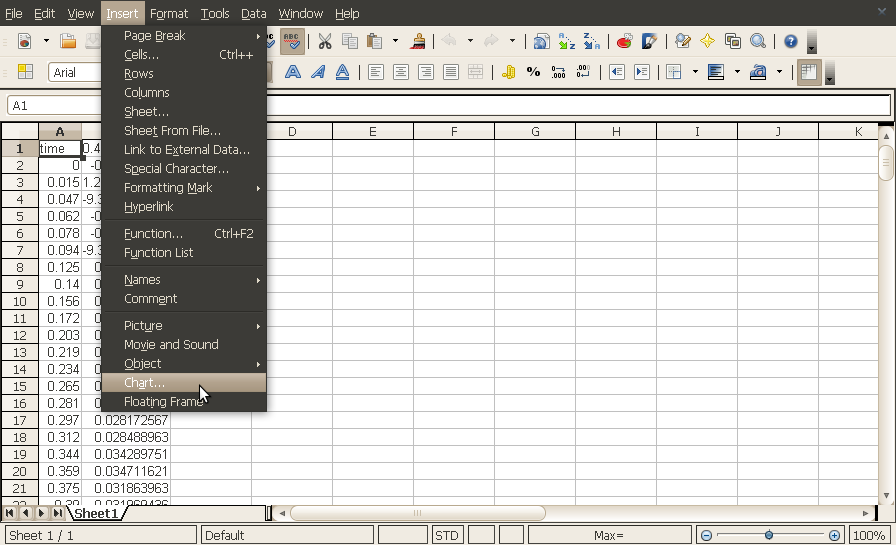
3. Create a chart
You should see the timeseries data in 2 columns. Now go to the menu and select "Insert/Chart?..."

|
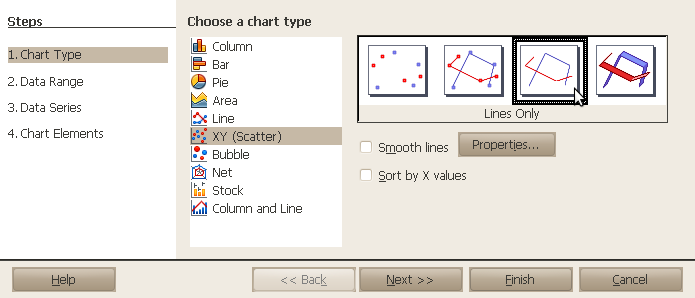
4. Choose a chart type
Choose the "X/Y (Scatter)" chart type. Select "Lines Only".

|
5. Add some labels to the chart
Select "4. Chart Elements" to add some labels. Uncheck "Display Legend". You can check how your graph looks as you proceed. When you are happy with your graph, click "Finish".

|
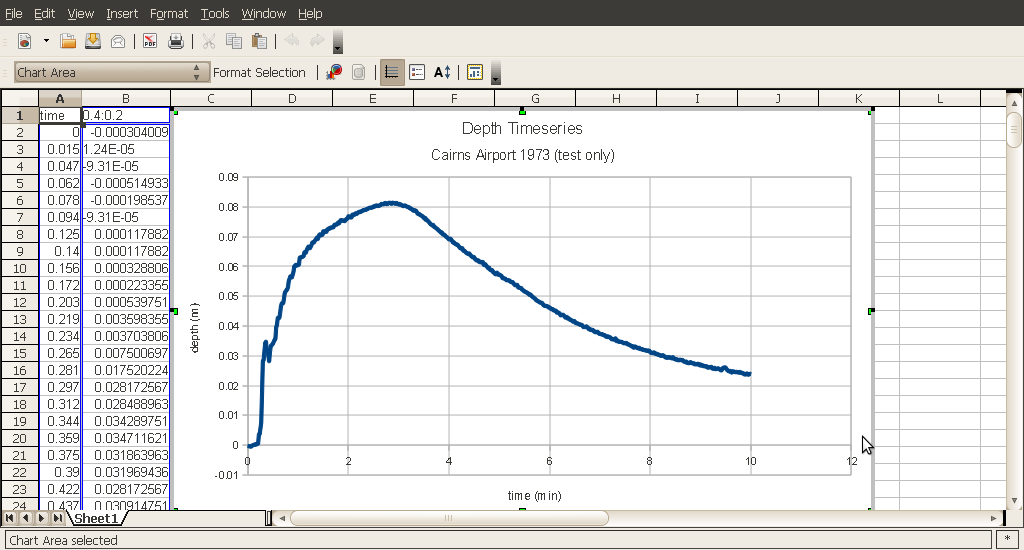
6. Finished!
You can now resize your graph, copy it to another program, or print it. If you want to change the line thicknesses of the graph or other visual styles, right click on the line you wish to change and choose an option to modify.

|
Attachments (6)
-
csv_0.png (33.5 KB) - added by 15 years ago.
Step 1
-
csv_1.png (24.8 KB) - added by 15 years ago.
Step 2
-
csv_2.png (40.4 KB) - added by 15 years ago.
Step 3
-
csv_3.png (18.7 KB) - added by 15 years ago.
Step 4
-
csv_4.png (15.3 KB) - added by 15 years ago.
Step 5
-
csv_5.png (44.0 KB) - added by 15 years ago.
Step 6
Download all attachments as: .zip